UNITED STATES
SECURITIES AND EXCHANGE COMMISSION
Washington, D.C. 20549
FORM
CURRENT REPORT
PURSUANT TO SECTION 13 OR 15(D) OF THE
SECURITIES EXCHANGE ACT OF 1934
Date of report (Date of earliest event reported):
(Exact Name of Registrant as Specified in its Charter)
|
(State or Other Jurisdiction of Incorporation) |
(Commission File Number) |
(IRS Employer Identification No.) |
|
|
||
| (Address of Principal Executive Offices) | (Zip Code) |
(
(Registrant’s telephone number, including area code)
Not applicable
(Former Name or Former Address, if Changed Since Last Report)
Check the appropriate box below if the Form 8-K filing is intended to simultaneously satisfy the filing obligation of the registrant under any of the following provisions:
Securities registered pursuant to Section 12(b) of the Exchange Act:
| Title of each class | Trading symbol | Name on each exchange on which registered | ||
Indicate by check mark whether the registrant is an emerging growth company as defined in Rule 405 of the Securities Act of 1933 (§230.405 of this chapter) or Rule 12b-2 of the Securities Exchange Act of 1934 (§240.12b-2 of this chapter).
Emerging growth company
If an emerging growth company, indicate by check mark if the registrant has elected not to use the extended transition period for complying with any new or revised financial accounting standards provided pursuant to Section 13(a) of the Exchange Act. ¨
| Item 7.01. | Regulation FD Disclosure. |
In connection with discussions with certain holders of its 0.00% convertible senior notes due in 2026 (the “Noteholders”) with respect to potential strategic or capital markets transactions (a “Potential Transaction”) to enhance the capital structure of SmileDirectClub, Inc. (the “Company”), the Company entered into confidentiality agreements that require the Company to publicly disclose certain confidential information provided to such counterparties (the “Cleansing Material”) upon the occurrence of certain events.
While discussions are ongoing as of the date hereof, the Company has not reached an agreement with respect to a Potential Transaction and there can be no assurances that any such agreement will be reached in the future, while the Company explores its other options. The latest proposed term sheets exchanged between the Company and the Noteholders concerning such a Potential Transaction contemplated a delayed draw term loan and an uptier exchange transaction with the Noteholders. The Company is furnishing the proposed term sheets as Exhibits 99.1 and 99.2 hereto and the Cleansing Material as Exhibit 99.3 in satisfaction of its obligations under such confidentiality agreements.
The information furnished in this Current Report on Form 8-K, including the information set forth in Exhibits 99.1, 99.2 and 99.3 attached hereto, is being furnished and shall not be deemed filed for purposes of Section 18 of the Securities Exchange Act of 1934, as amended (the “Exchange Act”), or otherwise subject to the liabilities of that Section, and shall not be incorporated by reference into any registration statement or other document filed under the Securities Act of 1933, as amended, or the Exchange Act, except as shall be expressly set forth by specific reference in such filing.
Forward Looking Statements
This Current Report on Form 8-K contains forward-looking statements. All statements other than statements of historical facts may be forward-looking statements. Forward-looking statements generally relate to future events and include, without limitation, projections, forecasts and estimates about possible or assumed future results of our business, financial condition, liquidity, results of operations, plans, and objectives. Some of these statements may include words such as “expects,” “anticipates,” “believes,” “estimates,” “targets,” “plans,” “potential,” “intends,” “projects,” and “indicates.”
Although they reflect our current, good faith expectations, these forward-looking statements are not a guarantee of future performance, and involve a number of risks, uncertainties, estimates, and assumptions, which are difficult to predict. Some of the factors that may cause actual outcomes and results to differ materially from those expressed in, or implied by, the forward-looking statements include, but are not necessarily limited to: the current noncompliance with the minimum bid requirement pursuant to the Nasdaq Listing Rules; the duration and magnitude of the COVID-19 pandemic and related containment measures; our management of growth; the execution of our business strategies, implementation of new initiatives, and improved efficiency; our sales and marketing efforts; our manufacturing capacity, performance, and cost; our ability to obtain future regulatory approvals; our financial estimates and needs for additional financing; consumer acceptance of and competition for our clear aligners; our relationships with retail partners and insurance carriers; our R&D, commercialization, and other activities and expenditures; the methodologies, models, assumptions, and estimates we use to prepare our financial statements, make business decisions, and manage risks; laws and regulations governing remote healthcare and the practice of dentistry; our relationships with vendors; the security of our operating systems and infrastructure; our risk management framework; our cash and capital needs; our intellectual property position; our exposure to claims and legal proceedings; and other factors described in our filings with the Securities and Exchange Commission, including but not limited to our Annual Report on Form 10-K for the year ended December 31, 2022.
| Item 9.01. | Financial Statements and Exhibits. |
(d) Exhibits
Exhibit No. |
Description |
| 99.1 | Proposed Term Sheet from the Company to the Noteholders |
| 99.2 | Proposed Term Sheet from the Noteholders to the Company |
| 99.3 | Cleansing Materials |
| 104 | Cover Page Interactive Data File (embedded within the Inline XBRL document). |
SIGNATURE
Pursuant to the requirements of the Securities Exchange Act of 1934, the registrant has duly caused this report to be signed on its behalf by the undersigned hereunto duly authorized.
| SMILEDIRECTCLUB, INC. | |||
| Date: March 27, 2023 | By: | /s/ Troy Crawford | |
| Troy Crawford | |||
| Chief Financial Officer | |||
Exhibit 99.1

Ducera Confidential. Subject to FRE 408. Preliminary Draft – Subject to Material Revision. Illustrative Transaction Counterproposal Project Grin March 23, 2023

Ducera Confidential. Subject to FRE 408. Preliminary Draft – Subject to Material Revision. ▪ Below reflects a summary of proposed key terms with respect to the new money capital (“Secured Delayed Draw Term Loan”): Summary of Key Terms: Secured Delayed Draw Term Loan 2 Secured Delayed Draw Term Loan Company Counter (3/23) Borrowers / Obligors ▪ Same as HPS Facility: additional obligors TBD based on diligence Commitment ▪ $85M Availability ▪ ( i ) $45 million available at close ▪ (ii) $40 million available upon release of Q3 2023 results, expected to be released on November 1, 2023 − Minimum liquidity covenant in accordance with HPS / ABL facility − Achievement of Adjusted GAAP EBITDA, based on cumulative Q2 and Q3 2023 results with 20% downside cushion. Adjusted GAAP EBIT DA based on the core business (see schedule attached) − Launch of SmileMaker in the United States Maturity ▪ August 1, 2025 (6 months prior to existing convertible maturity) Interest Rate ▪ 10.0% cash interest and 7.0% share - pay ▪ Payable monthly ▪ Share - pay delivery mechanic: [TBD] ▪ No ticking fee Security and Collateral ▪ 2 nd lien to HPS Facility (or future ABL facility) collateral ▪ 1 st lien on all unencumbered assets Covenants ▪ Customary for a facility of this nature, including the following: − Information rights, including 13 - week cash flows [TBD] − EOD if total liquidity falls below the greater of: ( i ) minimum liquidity as required under HPS Facility (or future ABL facility) and (ii) $30M Warrant Package ▪ Upfront fee equal to 5.0% of the drawn amount ($45M) payable in freely tradeable shares upon funding. The remaining warrant f ee of 5% will be earned upon funding of additional $40M Board and Governance ▪ 1 Board Seat. Lender to put forth 3 candidates with the company able to choose from the selected candidates Fees and Expenses ▪ SDC will pay reasonable and documented fees and expenses incurred by the Noteholders, solely associated with the engagement o f D ucera Partners and Paul Weiss Make - Whole Call ▪ Traditional make - whole upon a Change of Control or Fundamental Change ▪ Provisionally callable at the Company’s election [TBD] Other ▪ Subject to achieving satisfactory intercreditor agreement with HPS or having the HPS Facility refinanced, subject to a satisf act ory intercreditor agreement ▪ Customary registration rights

Ducera Confidential. Subject to FRE 408. Preliminary Draft – Subject to Material Revision. ▪ Below reflects a summary of proposed key terms with respect to the new uptiered convertible notes (“New Notes”): Summary of Key Terms: New Notes 3 New Notes Company Counter (3/23) Exchange Terms ▪ Exchange of existing 0.0% Convertible Notes into new convertible notes at an exchange rate of 60% of par ▪ Full exchange to be executed at transaction close ▪ Exchange only for new money participants with a maximum participation of $315 million of principal 0.0% Convertible Notes Maturity ▪ February 1, 2026 Interest Rate ▪ 5.0% cash or 7.0% share - pay at the Company’s election ▪ Share - pay delivery mechanic: [TBD] Security and Collateral ▪ 3 rd lien to HPS Facility (or future ABL facility) collateral ▪ 2 nd lien on Secured Delayed Draw Term Loan collateral Conversion ▪ Conversion Price struck at $1.00 ▪ Underlying shares to be freely tradeable at transaction close Covenants ▪ Customary for a facility of this nature, including the following: − Information rights, including 13 - week cash flows [TBD] − EOD if total liquidity falls below the greater of: ( i ) minimum liquidity under HPS Facility (or future ABL facility) and (ii) $ 40 30M Board and Governance ▪ None Fees and Expenses ▪ SDC will pay reasonable and documented fees and expenses incurred by the Noteholders, solely associated with the engagement o f D ucera Partners and Paul Weiss Make - Whole and Callability ▪ Traditional make - whole upon a Change of Control or Fundamental Change ▪ Make - whole interest upon Voluntary Conversion shall be equal to the lesser of ( i ) 2 - years or (ii) until the stated maturity ▪ Provisionally callable at the Company’s election if share price exceeds 150% of the Conversion Price for 20 of 30 days

Ducera Confidential. Subject to FRE 408. Preliminary Draft – Subject to Material Revision. ▪ Below we outline the Q2 and Q3 2023 EBITDA forecasts based on the latest financial model. The second draw of capital will be con tingent upon achievement of the cumulative Q2 and Q3 forecast with a 20% downside cushion along with the other draw conditions. ▪ Draw Conditions – The Company will satisfy the second draw condition upon achievement of Adjusted GAAP EBITDA, based on the combined Q2 and Q3 results with 20% downside cushion – The below schedule outlines the projected EBITDA forecast for the periods and 20% downside cushion Projected 2023 Quarterly Forecasts (Adjusted GAAP EBITDA) 4 Quarterly Forecast Cumulative Forecast 20% Downside Cushion Q2'23 ($11,524,740) ($11,524,740) - Q3'23 $1,347,341 ($10,177,399) ($12,212,879)

Ducera Confidential. Subject to FRE 408. Preliminary Draft – Subject to Material Revision. The information herein has been prepared exclusively for the Recipient by Ducera Partners LLC ("Ducera"). The information con tai ned herein is based on publicly available sources and Ducera has not assumed any responsibility for independently verifying such informatio n. No representation or warranty, express or implied, is or will be made, and no responsibility or liability is or will be accepted , b y Ducera or by any of its officers, directors or agents as to or in relation to the accuracy or completeness of any information contained herein. I n f urnishing this information, Ducera undertakes no obligation to provide the Recipient with access to additional information, to update any in for mation contained herein, or to correct any inaccuracies herein. These materials and the information contained herein are confidenti al and may not be disclosed publicly or made available to third parties without the prior written consent of Ducera. Disclaimer
Exhibit 99.2

Ducera Confidential. Subject to FRE 408. Preliminary Draft – Subject to Material Revision. Illustrative Transaction Counterproposal Project Grin March 26, 2023

Ducera Confidential. Subject to FRE 408. Preliminary Draft – Subject to Material Revision. ▪ Below reflects a summary of proposed key terms with respect to the new money capital (“Secured Delayed Draw Term Loan”): Summary of Key Terms: Secured Delayed Draw Term Loan 2 Secured Delayed Draw Term Loan Noteholders Counter (3/26) Borrowers / Obligors ▪ Same as HPS Facility: additional obligors TBD based on diligence Commitment ▪ $85M Availability ▪ ( i ) $40 million available at close ▪ (ii) $45 million available upon release of Q3 2023 results, expected to be released on November 1, 2023 − Minimum liquidity covenant in accordance with HPS / ABL facility − Achievement of Adjusted GAAP EBITDA, based on cumulative Q2 and Q3 2023 results with 20% downside cushion. Adjusted GAAP EBIT DA based on the fully consolidated business − Launch of SmileMaker in the United States Maturity ▪ August 1, 2025 (6 months prior to existing convertible maturity) Interest Rate ▪ 10.0% cash interest and 7.0% share - pay ▪ Payable monthly ▪ Share - pay delivery mechanic: [TBD] ▪ No ticking fee Security and Collateral ▪ 2 nd lien to HPS Facility (or future ABL facility) collateral ▪ 1 st lien on all unencumbered assets Covenants ▪ Customary for a facility of this nature, including the following: − Information rights, including 13 - week cash flows [TBD] − EOD if total liquidity falls below the greater of: ( i ) minimum liquidity as required under HPS Facility (or future ABL facility) and (ii) $30M Warrant Package ▪ Upfront fee equal to 5.0% of the drawn amount ($ 40M ) upon funding ▪ The remaining warrant fee of 5% will be earned upon funding of additional $ 45M ▪ Fees payable in penny warrants or freely tradeable shares, at the holders’ discretion Board and Governance ▪ 1 Board Seat. Lender to put forth up to 3 candidates with the company able to choose from the selected candidates Fees and Expenses ▪ SDC will pay reasonable and documented fees and expenses incurred by the Noteholders solely associated with the engagement of Du cera Partners and Paul Weiss ▪ 66.6% payable upon funding of first tranche; remainder payable upon funding of second tranche Make - Whole Call ▪ Traditional make - whole upon a Change of Control or Fundamental Change ▪ Provisionally callable at the Company’s election [TBD] Other ▪ Subject to achieving satisfactory intercreditor agreement with HPS or having the HPS Facility refinanced, subject to a satisf act ory intercreditor agreement ▪ Customary registration rights Achievement of Adjusted GAAP EBITDA, based on cumulative Q2 and Q3 2023 results with 20% downside cushion. Adjusted GAAP EBIT DA based on the

Ducera Confidential. Subject to FRE 408. Preliminary Draft – Subject to Material Revision. ▪ Below reflects a summary of proposed key terms with respect to the new uptiered convertible notes (“New Notes”): Summary of Key Terms: New Notes 3 New Notes Noteholders Counter (3/26) Exchange Terms ▪ Exchange of existing 0.0% Convertible Notes into new convertible notes at an exchange rate of 60% of par ▪ Full exchange to be executed at transaction close ▪ Exchange only for new money participants with a maximum participation of $240 million of principal 0.0% Convertible Notes Maturity ▪ November 2, 2025 Interest Rate ▪ 5.0% cash or 7.0% share - pay at the Company’s election ▪ Share - pay delivery mechanic: [TBD] Security and Collateral ▪ 3 rd lien to HPS Facility (or future ABL facility) collateral ▪ 2 nd lien on Secured Delayed Draw Term Loan collateral Conversion ▪ Conversion Price struck at 60¢ ▪ Underlying shares to be freely tradeable at transaction close Covenants ▪ Customary for a facility of this nature, including the following: − Information rights, including 13 - week cash flows [TBD] − EOD if total liquidity falls below the greater of: ( i ) minimum liquidity under HPS Facility (or future ABL facility) and (ii) $ 40M Board and Governance ▪ None Fees and Expenses ▪ SDC will pay reasonable and documented fees and expenses incurred by the Noteholders solely associated with the engagement of Du cera Partners and Paul Weiss ▪ 66.6% payable upon funding of first tranche; remainder payable upon funding of second tranche Make - Whole and Callability ▪ Traditional make - whole upon a Change of Control or Fundamental Change ▪ Make - whole interest upon Voluntary Conversion shall be equal to the lesser of ( i ) 2 - years or (ii) until the stated maturity ▪ Provisionally callable at the Company’s election if share price exceeds 150% of the Conversion Price for 20 of 30 days

Ducera Confidential. Subject to FRE 408. Preliminary Draft – Subject to Material Revision. The information herein has been prepared exclusively for the Recipient by Ducera Partners LLC ("Ducera"). The information con tai ned herein is based on publicly available sources and Ducera has not assumed any responsibility for independently verifying such informatio n. No representation or warranty, express or implied, is or will be made, and no responsibility or liability is or will be accepted , b y Ducera or by any of its officers, directors or agents as to or in relation to the accuracy or completeness of any information contained herein. I n f urnishing this information, Ducera undertakes no obligation to provide the Recipient with access to additional information, to update any in for mation contained herein, or to correct any inaccuracies herein. These materials and the information contained herein are confidenti al and may not be disclosed publicly or made available to third parties without the prior written consent of Ducera. Disclaimer
Exhibit 99.3

1 3/26/23 Update

2 Forward - Looking Statements This presentation contains forward - looking statements. All statements other than statements of historical facts may be forward - l ooking statements. Forward - looking statements generally relate to future events and include, without limitation, projections, forecasts and estimates ab out possible or assumed future results of our business, financial condition, liquidity, results of operations, plans, and objectives. Some of these statemen ts may include words such as “expects,” “anticipates,” “believes,” “estimates,” “targets,” “plans,” “potential,” “intends,” “projects,” and “indicates.” Although they reflect our current, good faith expectations, these forward - looking statements are not a guarantee of future performance, and involve a number of risks, uncertainties, estimates, and assumptions, which are difficult to predict . Some of the factors that may cause actual outcomes and results to differ materially from those expressed in, or implied by, the forward - looking statements include, but are not necessarily limited to : the current noncompliance with the minimum bid requirement pursuant to the Nasdaq Listing Rules ; the duration and magnitude of the COVID - 19 pandemic and related containment measures ; our management of growth ; the execution of our business strategies, implementation of new initiatives, and improved efficiency ; our sales and marketing efforts ; our manufacturing capacity, performance, and cost ; our ability to obtain future regulatory approvals ; our financial estimates and needs for additional financing ; consumer acceptance of and competition for our clear aligners ; our relationships with retail partners and insurance carriers ; our R&D, commercialization, and other activities and expenditures ; the methodologies, models, assumptions, and estimates we use to prepare our financial statements, make business decisions, and manage risks ; laws and regulations governing remote healthcare and the practice of dentistry ; our relationships with vendors ; the security of our operating systems and infrastructure ; our risk management framework ; our cash and capital needs ; our intellectual property position ; our exposure to claims and legal proceedings ; and other factors described in our filings with the Securities and Exchange Commission, including but not limited to our Annual Report on Form 10 - K for the year ended December 31 , 2022 . New risks and uncertainties arise over time, and it is not possible for us to predict all such factors or how they may affect us . You should not place undue reliance on forward - looking statements, which speak only as of the date they are made. We are under no duty to update any of these forward - l ooking statements after the date of this presentation to conform these statements to actual results or revised expectations. You sho uld , therefore, not rely on these forward - looking statements as representing our views as of any date subsequent to the date of this presentation. Market and Industry Data This presentation also contains estimates and other statistical data obtained from independent parties and by us relating to mar ket size and growth and other data about our industry and ultimate consumers. This data involves a number of assumptions and limitations, and you are cauti one d not to give undue weight to such estimates and data. In addition, projections, assumptions, and estimates of our future performance and the future perfor man ce of the geographic and other markets in which we operate are necessarily subject to a high degree of uncertainty and risk. We provide additional di scl osures regarding our marketing claims on our web site which can found at smiledirectclub.com/claims/. Non - GAAP Financial Measures This presentation contains certain non - GAAP financial measures, including adjusted EBITDA (“Adjusted EBITDA”) and Free Cash Flow . We utilize certain non - GAAP measures, including Adjusted EBITDA, and Free Cash Flow to evaluate our actual operating performance and for planning and forecasting of future periods . These non - GAAP measures should not be considered in isolation or as a substitute for the related GAAP measures, and other companies may define such measures differently . We provide a reconciliation of these non - GAAP financial measures to the most directly comparable GAAP financial measures in the appendix to this presentation and in our Current Report on Form 8 - K announcing our quarterly earnings results, which can be found on the SEC’s website at www . sec . gov and our website at investors . smiledirectclub . com . We do not provide a reconciliation of forward - looking Adjusted EBITDA to the most directly comparable GAAP financial measure (net loss), as the reconciliation to the corresponding GAAP measure is not available due to the variability, complexity and limited visibility of the non - cash items that are excluded from forward - looking Adjusted EBITDA . This presentation is a supplement to, and should be read in conjunction with, SmileDirectClub’s earnings release for the quarter ended December 31 , 2022.

3 Mission driven business delivering shareholder value through innovation.

Our Vision: Become the world’s leading oral care brand by helping more people realize the life - changing potential of a confident smile. 4

We started by disrupting the 120+ year old orthodontic industry. We created the first telehealth platform for orthodontia that connects doctors with their patients, removing significant barriers to open teeth straightening to entirely new populations where it was historically out of reach. Now, with a winning team and best - in - class partnerships , we’re making it increasingly convenient, more affordable, and more comfortable by utilizing the transformative innovations in digital scanning, materials science, and taking a “big data” approach to treatment planning and in - treatment monitoring to improve outcomes. Evolve the brand into an everyday oral care staple: Through transformative innovation , we will democratize access to quality daily routine oral care products with superior performance. SmileDirectClub should own the oral care half of the bathroom vanity countertop. This grows our brand presence and connection points by offering oral care products in retail, and online, and through subscription models, keeping us physically present to be top of mind. Extend the access spectrum: Building on the success we’ve seen with our telehealth model, we will launch offerings that appeal to even more people , including orthodontia’s traditional customers. This includes a higher - end, hybrid (in - person and virtual) service model for teens and high - income households delivered via a large and comprehensive network of dental offices. Establish SDC as the largest referrer of dental care: Strengthen our Partner Network by introducing partner practices to new patients as the first step in their teeth straightening journey and through AI - driven diagnosis via connected devices . Our vision. 5
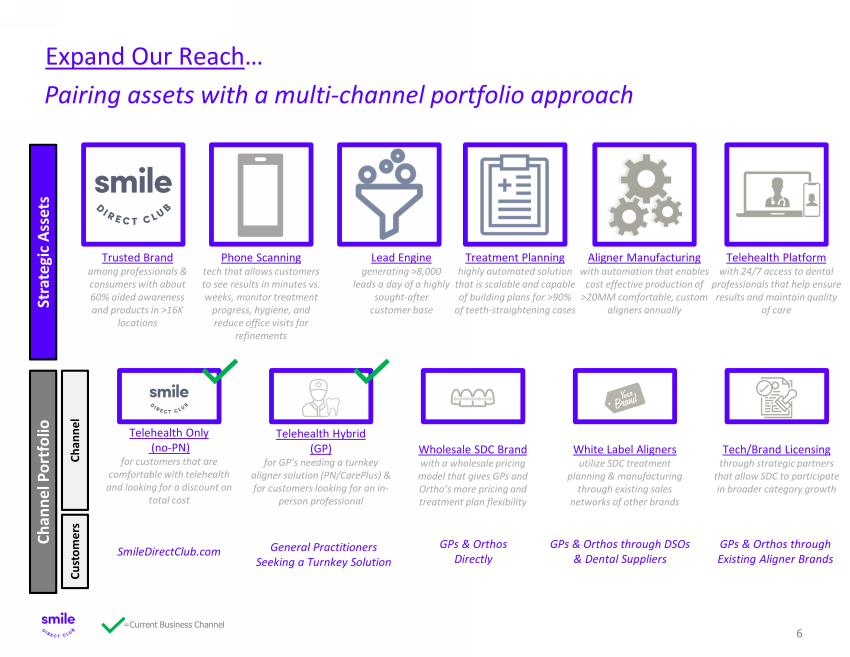
Pairing assets with a multi - channel portfolio approach 6 Expand Our Reach … Trusted Brand among professionals & consumers with about 60% aided awareness and products in >16K locations Lead Engine generating >8,000 leads a day of a highly sought - after customer base Treatment Planning highly automated solution that is scalable and capable of building plans for >90% of teeth - straightening cases Aligner Manufacturing with automation that enables cost effective production of >20MM comfortable, custom aligners annually Telehealth Platform with 24/7 access to dental professionals that help ensure results and maintain quality of care Phone Scanning tech that allows customers to see results in minutes vs. weeks, monitor treatment progress, hygiene, and reduce office visits for refinements Strategic Assets Channel Portfolio Telehealth Only (no - PN) for customers that are comfortable with telehealth and looking for a discount on total cost Tech/Brand Licensing through strategic partners that allow SDC to participate in broader category growth White Label Aligners utilize SDC treatment planning & manufacturing through existing sales networks of other brands Wholesale SDC Brand with a wholesale pricing model that gives GPs and Ortho’s more pricing and treatment plan flexibility Telehealth Hybrid (GP) for GP’s needing a turnkey aligner solution (PN/ CarePlus ) & for customers looking for an in - person professional Channel Customers SmileDirectClub.com General Practitioners Seeking a Turnkey Solution GPs & Orthos Directly GPs & Orthos through DSOs & Dental Suppliers =Current Business Channel GPs & Orthos through Existing Aligner Brands

Our Mission: Democratize access to a smile each and every person loves. through driven by with Grow existing base and acquire new customer segments Dissatisfaction with the status quo coupled with a pipeline of innovation Attracting and retaining top talent and partners Demonstrating investment focus and discipline across the organization in every decision we make Expand our reach Transformative innovation A winning team Rigorous financial discipline Our strategic pillars. 7
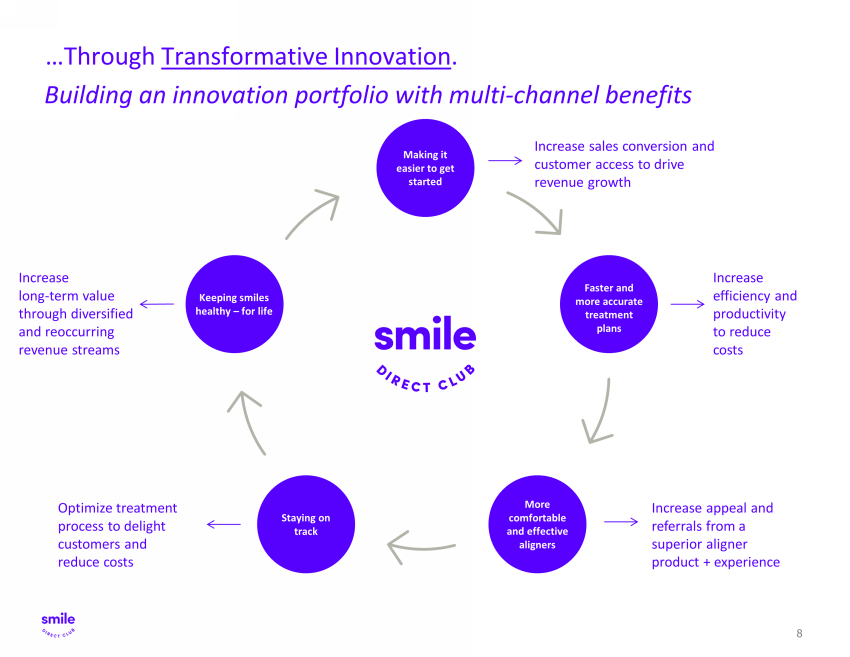
Making it easier to get started Faster and more accurate treatment plans More comfortable and effective aligners Staying on track Keeping smiles healthy – for life Increase sales conversion and customer access to drive revenue growth Increase efficiency and productivity to reduce costs Increase appeal and referrals from a superior aligner product + experience Optimize treatment process to delight customers and reduce costs Increase long - term value through diversified and reoccurring revenue streams Building an innovation portfolio with multi - channel benefits 8 …Through Transformative Innovation .

5 1 9 Key initiative overview.

10 Our SmileMaker Platform uses AI scanning through your smartphone to deliver a view of your potential new smile in minutes. This transformative process will shrink the ability to scan and buy your aligners from weeks to minutes. Entire scan done in approximately 2 minutes

11 SmileMaker Platform is an innovative proprietary AI technology that will drive stronger sales conversion rates. Buy Aligners Download Scan / Draft Treatment Plan 1 – 3 Minutes 1.5K 200K website and app store daily visitors 0.50% Buy Aligners Kits & Scans Smile Assessment 1 – 3 Weeks website daily visitors CURRENT STATE SmileMaker 1K 200K Illustrative example of increased conversion from SmileMaker : Reduces time from scan to order from weeks to minutes SmileMaker Model Summary • Current web site conversion rate per visitor is ~0.5% • Large opportunity to increase web site conversion rate by leveraging proprietary AI technologies to shorten treatment plan presentation to customer and the ability to buy now • A 25bps of improvement would be worth ~$200 million in annual incremental aligner revenue and up to $160 million Adjusted EBITDA Buy Aligners 0.75% Current Funnel Drop Offs • Show rate • Cancel rate • Reschedule rate • Kit return • Impression acceptance rate • Retake kit • Photo upload • Photo acceptance

Refined production know - how and scale capabilities of core 22 - hour aligner and nighttime product s Clear aligner product combined with an initial set of retainers and other SDC products Price leadership at a lower cost to traditional braces and competitor clear aligners – $ 2 , 0 50 or $89 per month A higher price point at $3,900 which provides enhanced access to care, while improving economics to both Partners and SDC Historically focused on serving the $70k income consumer without previous access to teeth straightening Expanding customer base to higher income and teen segments 24/7 global customer care team with app enabled support High touch, white - glove experience including in person clinician visits, with access to both locally - based and telehealth doctor enabled enhancements Journey entry points primarily via SmileMaker or SmileShop scans and secondarily via the Partner Network Partner network provides CarePlus access to target customer. Traditional Customer Expanded Customer Base with CarePlus 12 Mandatory in person office visit required via Partner Network or SmileShop located in dental office with pilot launched in Q1 2023

CarePlus $3900 Overall (incomes $25K and up) 70% Under $125K (net) 68% $25,000 to $49,999 61% $50,000 - $74,999 66% $75,000 - $124,999 75% $125K+ (net) 73% 72% $150,000 to $199,999 71% $200,000 to $299,999 73% $300,000 or more 83% CarePlus research confirms strength of offering CarePlus is a compelling proposition for HHI consumers. 73% of higher household income customers surveyed indicated a likelihood to purchase. 1 1) Source: CarePlus Quant Research, April 2022, n = 2,126 (US HHI $125K+). Research with US gen pop, 18 - 65 years old, who are interested in straightening their teeth, or their teen’s, in next 3 years, or have straightened their teeth or their teen’s in the past 3 years, or are currently in treatment for themselves or th eir teen’s. 2) Source: Qualitative Research conducted by a third - party, Actionable research, May - June 2022, n = 12. Research with Partner Network dentists with pra ctices that serve mostly higher income households ($125K+). Interest in CarePlus concept by income bracket Interest in CarePlus is strong with existing Partner Network partners to expand their offering with CarePlus. 2 92% of current partners would like to have both traditional SmileDirectClub & SmileDirectClub CarePlus options Is a great clinical fit Because SmileDirectClub CarePlus … Enhances compliance Will help retain & refer patients Provides economic benefit HHI Consumers Current Partners

14 A brand customers love & a business positioned for growth.

Brand and business model are well positioned to take advantage of large market with unique set of strategic assets. 15 Large and growing market 1 ▪ Global orthodontics market is large and underserved, and TAM is expanding as aligners are more accessible ▪ Secular shift from wires and brackets to clear aligners ▪ COVID - 19 has accelerated facetime: we’ve never been more aware of our own smiles Trusted brand among customers & professionals 2 ▪ B rand that consumers love (more than 1.7M smiles straightened) ▪ Second largest aligner brand and largest DTC orthodontics brand in the world ▪ Premier t eledentistry platform offering consumers accessibility & convenience Leading orthodontic telehealth channel 3 ▪ Largest DTC orthodontic channel in the world provides attractive unit economics and substantial growth despite temporary macroeconomic factors ▪ Strong omnichannel presence maximizes consumer addressability ▪ Closed loop system offers optimal conversion from sophisticated CRM strategy and opportunities to enhance clinical outcomes from robust data library Differentiated value proposition via teledentistry platform 4 ▪ Complementary to DTC offering, meeting patients where and when they are: in - chair or at home ▪ Professional channel strategy enhances options for consumers to seek treatment, broadening addressability ▪ Addresses key consumer demands offering convenience, access and lower cost of care Vertically integrated model 5 ▪ Substantial investment in treatment planning, manufacturing, contact center and teledentistry platform ▪ >$300M of capex, including streamlined state - of - the - art manufacturing facility in Tennessee ▪ Vertically integrated model allows business to gain profitable leverage on scale and effectively focus on the end - to - end customer experience ▪ B rand that consumers love (more than 1.9M smiles straightened) ▪ Second largest aligner brand and largest telehealth orthodontics brand in the world ▪ Premier t eledentistry platform offering consumers accessibility & convenience ▪ Largest telehealth orthodontic channel in the world provides attractive unit economics and substantial growth despite temporary macroeconomic factors ▪ Strong omnichannel presence maximizes consumer addressability ▪ Closed loop system offers optimal conversion from sophisticated CRM strategy and opportunities to enhance clinical outcomes from robust data library ▪ Complementary to telehealth offering, meeting patients where and when they are: in - chair or at home ▪ Professional channel strategy enhances options for consumers to seek treatment, broadening addressability ▪ Addresses key consumer demands offering convenience, access and lower cost of care ▪ Substantial investment in treatment planning, manufacturing, contact center and teledentistry platform ▪ >$400M of capex, including streamlined state - of - the - art manufacturing facility in Tennessee ▪ Vertically integrated model allows business to gain profitable leverage on scale and effectively focus on the end - to - end customer experience

We’ve brought >1.9MM smiles to customers worldwide through our professional network of licensed orthodontists & dentists. 16 232 K initial aligner orders shipped 1 1.9M+ smiles straightened An affiliated network of state - licensed doctors in our telehealth platform 10M+ annual a ligners trays produced 2 1) Shipped in 2022. 2) Produced in 2022. 3) Calculated using the SinglePay price for SmileDirectClub aligners as of 4/20/2022 vs. average fees (including diagnostics and in - person exams) for treatment of mild - to - moderate malocclusion with braces as reported in a survey of orthodontists. Price compari son does not include additional costs, such as retainers. As treatment is highly individualized, results may not be the same. $5B+ saved by consumers who chose SmileDirectClub aligners over braces since 2014 3 1 Large and growing market

17 C onsumers considering straightening their teeth typically do one or all of the following: 1. S earch online to understand their options 2. Ask a friend or family member which option they should choose 3. Ask a dentist Based on our research, our product and customer experience is competitive with Invisalign and less expensive. 1 Our focus continues to be on improving perception across these three channels to continue to gain market share. Changing perceptions, habits and beliefs is critical to the next phase of our growth as we work to expand our reach and overall share of the market . The following pages provide supplemental information to outline the progress we have made across these three channels. 1 Source: Third - party market research firm research on file at SmileDirectClub; Based on over 1,200 respondents. Online Dentist Friends & Family When customers are considering who to trust, they reference three important channels. 2 Trusted brand among customers & professionals

Source: Internal company surveys, public information . Data as of December 2022. 1 Average of Google and Trustpilot Review Ratings. 2 Source: Third - party NPS scores were independently sourced and calculated surveying 748 customers who completed clear aligner the rapy with SDC, Invisalign, or teledentistry competitors in the last 12 months. 18 We have made considerable progress on brand perception, and our satisfaction scores consistently track higher than telehealth peers. We have built a brand that our customers love. Approx. 21% of customers come from referrals. Avg Rating (1) 4.8/5.0 with over 108K member reviews. BBB rating of A+ 2 Trusted brand among customers & professionals Total # of Reviews 108,717 7,432 19,844 0 20,000 40,000 60,000 80,000 100,000 120,000 SDC Telehealth players DSO Total Google/Trustpilot Reviews 54 55 22.5 49 37 20.5 56 41 22.5 0 10 20 30 40 50 60 Invisalign SmileDirectClub Telehealth players Third - party NPS 2 Q3 2021 Q1 2022 Q3 20222

SmileDirectClub (Previous treatment) Please describe whether you consulted with a dental professional and whether they were positive, negative or neutral on the treatment option 1 Source: U.S. brand tracker (general population): Q3 2022. 1) 399 responses. 2) 536 responses. Invisalign (Previous treatment) Was the dental professional positive, negative or neutral on the treatment options? 2 Dental professional was positive Dental professional was neutral Dental professional was negative Dental professional was positive Dental professional was neutral Dental professional was negative SDC sentiment with dental professionals continues to rise – in line with Invisalign. 60% of customers consult with a dental professional when considering teeth straightening options. Of those customers, fewer are reporting their doctor expressed a negative sentiment while positive/neutral sentiment improves. 2 Trusted brand among customers & professionals

1 Source: Brand tracking survey with Aegis trade media publishers 2 Academy of Clear Aligners Fall 2021 Issue: AACA Digs Deeper. Published November 1. (Pages 10, 12.) Go to: https://bit.ly/3CITzsd for a copy of the report 20 200K General Practices (GPs) in North America looking to grow their patient base and revenue 2% Total GP revenue that is orthodontics 85% - 90% People worldwide eligible for treatment – a missed opportunity for GPs 85% SDC’s awareness with GPs is second only to Invisalign (95%) 1 61% Doctors who have some degree of interest in being part of our Partner Network and offering SmileDirectClub to patients 1 Our industry memberships, affiliations and partnerships are growing, most recently with the American Academy of Clear Aligners (AACA), which has turned from actively campaigning against SDC to asking us to become a member as demonstrated by their recent retraction in the AACA Journal Fall 2021 Issue. 2 Grow revenue The reason GPs are most interested in joining the Partner Network 1 We have a huge growth opportunity with GPs and the Partner Network, especially with the CarePlus offering. Doctors have high awareness of SmileDirectClub, are open to our offering, and are compelled by our value proposition. …and we continue to make progress in building credibility with the dental community. 2 Trusted brand among customers & professionals

21 Orthodontists have traditionally purchased invisible aligners from a wholesaler or manufacturer, marked up the cost and then sold them to consumers for $5,000 - $8,000. SDC's proprietary telehealth platform offers consumers the ability to get the same clinically safe and effective treatment, but without the markup. Customers choose the treatment option that works for them • Treatment plan is tailored using proprietary telehealth platform • All doctors have 4+ years of aligner experience • 100% of aligners are made in FDA registered and ISO certified 3D printing facility in Tennessee • Efficacy of teleorthodontic treatment with clear aligners validated by clinical research • Customers can start seeing results in as little as 60 days, and they can be certain in their outcome • All smiles come with a lifetime smile guarantee • Better oral hygiene – customers can brush and floss without brackets in the way • Deliver all aligners and retainers directly to the customer, upfront • ComfortSense is a unique soft, medium, firm plastic, which provides for more gradual movements and a more comfortable fit • Smooth edges and a custom - shaped aligner means less overlap and irritation of the gumline • Matte finish gives aligners a natural look • No buttons, attachments, or IPR • Two ways to wear aligners: 22 hours a day, or 10 continuous hours only at night • SDC Care original features pioneering remote treatment via SDC's teledentistry platform. SDC CarePlus offers a hybrid option with in - office and remote treatment plus enhanced service • With both options, aligners arrive up front – customers never wait on their next set • Experienced dental team is available 24/7 via text, video chat, email or phone • Customers use the app to track and manage their entire treatment • Two ways for customers to pay: one single payment or monthly over 26 months • 100% approval on financing, no credit check, no paperwork • In network with most major health insurers • Customers can use HSA, FSA, and CareCredit funds • All aligner touch - ups are included • Whitening is included 1.9M customers treated, with a brand at scale they love Certainty Comfort 3D image Convenience Cost Customers enjoy a new smile in as little as 4 - 6 months Laser - cut aligners look and feel better than ever Credibility SDC aligners cost as little as $3 / day Customers continue to choose SDC – now with even more options. 3 Leading orthodontic telehealth franchise

22 Traditional orthodontic model Cost $2,050 (1) $5,000 — $8,000 Limited access to treatment (Only approximately 40% of U.S. counties have orthodontists) Access across U.S., Canada, U.K., Australia and Ireland Access 5 – 10 months 12 – 24 months 10 – 15 orthodontist visits Doctor - directed remote teledentistry In - office visit optional Convenience Barred by poor credit Captive financing for accessible credit 100% approval rating Financing Kits, SmileShops , dentist office Utilizing clinically distinguished teledentistry to offer clear aligners affordably and conveniently. (1) Increased to $2,050 from $1,950 in April 2022 for U.S. with increases targeted for rest of world in Q2 and Q3 2022. 4 Differentiated value proposition via teledentistry platform

$42 $106 $97 $107 $50 2018 2019 2020 2021 2022 Historical Capex Over Time ($M) Antioch & Columbia, TN • 307K sq. ft combined Alajuela, Costa Rica • 45K sq. ft. Facilities Overview 23 • Vertically integrated business model allows the company to gain profitable leverage on scale and provide customers the best experience possible • Nashville, TN state - of - the - art facility represents America’s largest 3D printing and clear aligner production facility • >$400M capex over last 5 years resulted in streamlined manufacturing, positive trends and better customer experience ‒ Faster turnaround times ‒ Greater productivity and reduced labor ‒ Reduction in scrap ‒ Higher quality aligner trays • Investment in proprietary treatment planning software and virtual tools drive greater automation, improved outcomes and better customer experience • 2nd gen machines producing ~90% of aligners • Full redundancy back up facility in Columbia, TN Produced 10M+ individual aligner trays in 2022, averaging over 28K per day Commentary Substantial strategic value in vertically integrated business model. 5 Vertically integrated model

Q4 financial results. 24

$638 $471 $460 $328 ($133) ($135) ($248) ($210) FY 2021 FY 2022 Revenue Gross Profit Adjusted EBITDA FCF 25 Q4 2022 QoQ YoY Net Revenue $ 86.5mm (19.0%) (31.5%) Gross Profit $ 52.8mm (29.4%) (35.6%) Gross Margin % 61.0% (904 bps) (388 bps) Adjusted EBITDA (1) $ (47.3mm) $ (17.6mm) $ 14.3mm EPS, Diluted $ (0.18) $ - $ 0.07 Free Cash Flow (1) $ (63.3mm) $ (28.4mm) $ 16.4mm • Revenue for the quarter was $86.5 million, which is down (31.5%) year - over - year and down (19.0%) from Q3 2022, due to continued macroeconomic headwinds impacting our customers. • Gross margin for the quarter was 61.0%, which represents a (388 bps) decline year - over - year, and a (904 bps) decline compared to Q3 2022. • Gross margin decreased primarily due to the deleveraging of fixed costs on lower sales volume as well as higher impression kit volumes which have lower margins and higher holiday shipping costs. • Q4 Adjusted EBITDA (1) was $(47.3mm) for the quarter, a $14.3mm year - over - year improvement compared to Q4 2022, despite a ($39.8mm) decrease in revenue driven primarily by cost control actions including lower marketing costs. • Net loss for the quarter was ($69.4mm) an improvement of $26.0mm vs prior year. • Q4 Free Cash Flow improved $16.4 million compared to Q4 2021 • FY 2022 FCF improved $38 million compared to FY 2021, despite $167 million decrease in revenue Full Year Comparisons ($ in millions) FY 2022 revenue decreased $167 million compared to FY 2021 while Adjusted EBITDA decreased only $1 million and Free Cash Flow improved $38 million Q4 2022 results. (1) Adjusted EBITDA and Free Cash Flow are non - GAAP financial measure. See appendix for definition of Adjusted EBITDA and Free Cash Flow. Prior period reconciliations are available in historical SEC filings at https://investors.smiledirectclub.com/financial - filings/sec - filings .

70% 54% 70% 74% 76% 74% 71% 65% 72% 73% 70% 61% 4% Q1 2020 Q2 2020 Q3 2020 Q4 2020 Q1 2021 Q2 2021 Q3 2021 Q4 2021 Q1 2022 Q2 2022 Q3 2022 Q4 2022 26 Gross margin % (1) • Gross margin for the quarter was 61%, which represents 388 bps decrease from prior year and a 904 bps decrease compared to Q3 2022. • When compared to Q3 2022 and Q4 2021, approximately 400 bps relates to deleveraging of fixed costs due to lower Q4 2022 sales. • Remaining Q3 2022 variance to Q4 2022 relates to lower retail margins, higher holiday shipping costs and higher impression kit volume which has a higher cost relative to sales. • Full year 2022 margin was 70% compared to 72% in FY 2021. The decrease was primarily due to the deleveraging of fixed costs due to lower FY 2022 sales. • We continue to leverage our manufacturing automation enhancements with our 2nd Gen machines producing over 90% of our aligners in the quarter. • The Q4 2022 and FY 2022 decline in gross margin dollars driven by reduced revenue. 26 Gross margin. $450 $460 $328 FY 2020 FY 2021 FY 2022 Gross Profit (1) In Q4 2021, one - time costs related to the implementation of our internal treatment planning software, SmileOS and lower retail m argin, primarily due to higher expansion costs and excess inventory costs had an approximate 400 bps impact on margin.

• Marketing and selling expenses were $64 million, or 74.1% of net revenue in the quarter compared to 78.6% of net revenue in Q4 2021. • Total spend was down $35mm as we continue to focus on marketing efficiency and rationalized store costs. • Q4 higher spend as a % of revenue is due to the seasonal increase in preparation for higher volumes in Q1 associated with our “new year, new you” campaign. • Regarding locations, we had 124 permanent SmileShop locations as of quarter end, compared to 117 locations at the end of Q3 2022 • We also held 32 pop - up events over the course of the quarter, for a total of 156 location sites at the end of the quarter. • Current Partner Network global locations are now 1,078 active or pending training which represents a net increase of 128 locations from Q3 2022 • Increased Partner Network growth driven by new CarePlus rollout targeted for 1H 2023 • Full year costs were lower year over year due to the focus on efficiency measures throughout the year. $142 $35 $67 $79 $97 $96 $96 $99 $97 $71 $58 $64 72% 32% 40% 43% 49% 55 … 70% 79% 64% 57% 55% 74% Q1 2020 Q2 2020 Q3 2020 Q4 2020 Q1 2021 Q2 2021 Q3 2021 Q4 2021 Q1 2022 Q2 2022 Q3 2022 Q4 2022 Actual $ % of Net Revenue 27 Marketing & selling expenses ($ in millions) Q1 2020 Q2 2020 Q3 2020 Q4 2020 Q1 2021 Q2 2021 Q3 2021 Q4 2021 Q1 2022 Q2 2022 Q3 2022 Q4 2022 20 % 21 % 23 % 22 % 21 % 21 % 20 % 20 % 20 % 21 % 21 % 20 % 27 Referrals as a % of Aligner Orders Marketing & selling. $323 $388 $290 FY 2020 FY 2021 FY 2022 Marketing & selling expenses ($ in millions)

G&A expenses ($ in millions) $73 $58 $63 $66 $66 $72 $75 $63 $66 $64 $68 $55 $16 $11 $11 $7 $15 $12 $10 $7 $5 $8 $8 $5 $2 $5 $1 $1 $4 1 Q1 2020 Q2 2020 Q3 2020 Q4 2020 Q1 2021 Q2 2021 Q3 2021 Q4 2021 Q1 2022 Q2 2022 Q3 2022 Q4 2022 G&A Stock-based Compensation One-time Costs • General and administrative expenses were $60mm in Q4, compared to $76 million in Q3 2022 • The $55mm base G&A includes the reversal of $4mm of incentive compensation costs based on full year results • We also incurred lower legal expenses and reduced depreciation and amortization as a result of a decrease in capital spending over time. • Cost actions taken in January 2022 now achieving full run rate savings • We plan to stay vigilant with cost control throughout 2023 and beyond, as we focus on continuing to leverage this line item. • Full year G&A expense down $47mm year over year with a focus on cost control and financial discipline. 28 28 General & administrative. $261 $276 $252 $45 $45 $27 $7 $5 FY 2020 FY 2021 FY 2022 G&A Stock-based Compensation One-time Costs G&A expenses ($ in millions)

Net income (Loss) ($ in millions) Adj. EBITDA (1) ($ in millions) • Interest Expense: • Totaled $6.6 million in Q4 2022, of which $5.2 million is associated with the new debt facility secured in April 2022 and $1.4 million was deferred loan costs from with the convert we issued last year and capital lease expense • Other: • Other store closure and restructuring costs were ~$1.6 million primarily related to team member costs for severance or retention payments and international facility closure costs. • Unrealized currency gain impact of $3.4 million. • Other includes insurance proceeds from our cyberattack of approximately $7mm. • Q4 Adjusted EBITDA (1) was ($47.3) million for the quarter • US/Canada Adjusted EBITDA was ($34.5) million • Rest of World Adjusted EBITDA was ($12.8) million 29 29 Other expenses, Adj. EBITDA, and Net income. ($96) ($55) ($89) ($95) ($74) ($65) ($70) ($69) Q1 2021 Q2 2021 Q3 2021 Q4 2021 Q1 2022 Q2 2022 Q3 2022 Q4 2022 $5 ($23) ($54) ($62) ($34) ($23) ($30) ($47) Q1 2021 Q2 2021 Q3 2021 Q4 2021 Q1 2022 Q2 2022 Q3 2022 Q4 2022 (1) Adjusted EBITDA is a non - GAAP financial measure. See appendix for definition of Adjusted EBITDA. Prior period reconciliations are available in historical SEC filings at https://investors.smiledirectclub.com/financial - filings/sec - filings . ($77) ($133) ($135) FY 2020 FY 2021 FY 2022 Adj. EBITDA (1) ($ in millions)

($ in millions) Q1 2022 Q2 2022 Q3 2022 Q4 2022 Cash $144.7 $158.3 $120.2 $118.4 Debt $739.6 $792.2 $792.4 $849.4 Accounts Receivable, Net $240.5 $221.6 $201.8 $187.0 Cash Flow from Operations ($ 64.8) ($ 17.8) ($24.1) ($ 51.5) Cash Flow from Investing ($ 11.6) ($17.8) ($10.8) ($11.8) Free Cash Flow (1) ($ 76.4 ) ($35.6) ($34.9) ($ 63.3) 30 • We ended Q4 with $118.4 million in cash and cash equivalents. • Cash from operations for the fourth quarter was ($51.5) million. • Cash spent on investing for the fourth quarter was ($11.8) million • Free Cash Flow was ($63.3) million in the quarter compared to ($79.7) million in Q4 2021 • In Q4 2022, SmilePay financing, which drives our accounts receivable, as a percentage of total aligners purchased was 62.7%, which is about a 260 bps increase over Q3 2022. • Overall, SmilePay delinquency rates continue to be in line with past performance. SmilePay delinquency as a % of sales has increased as a result of lower current period sales. 30 Balance sheet highlights. (1) Free Cash Flow is a non - GAAP financial measure. See appendix for definition of Free Cash Flow. Prior period reconciliations are available in historical SEC filings at https://investors.smiledirectclub.com/financial - filings/sec - filings .
5 1 31 2023 guidance & macro customer impacts.

2023 Guidance includes Strategic Actions to Reduce Costs and Focus on Critical Business Needs. 32 SDC engaged a third - party advisor to evaluate cost saving opportunities while protecting key investment initiatives. Q1 2023 implementation with transition over a 6 - month period. $120MM to $140MM annual run rate cash savings by end of 2023 G&A Savings: $50MM to 55MM • Protects near - term profitability initiatives that launch during 2023 Marketing and Selling Savings: $60MM to $65MM • Continuing efforts to drive marketing efficiency and leverage new initiatives • Store rationalization and leverage new initiatives CapEx Savings: $10MM to $15MM • Reduction in overall investment by focusing on key initiatives • Completion of initiative investments to launch in 2023 COST SAVINGS PLAN

Between $400MM to $450MM • Represents core business only • Macro factors are key drivers for range of aligner orders driving revenue REVENUE Gross Margin: 72.0% to 75.0% • Efficiencies gained with increased aligner volumes leveraging fixed costs Adjusted EBITDA (1) : ($35MM) to ($5MM) • Range largely driven by top line revenue results • Positive Adjusted EBITDA by Q3 2023 Capex: $35MM to $45MM One - Time Costs: $12MM to $15MM • Reorganization costs which may include lease buyouts, asset impairments related to the closure of regional operating centers and SmileShops, and employee - related costs, including severance and retention payments, associated with the organizational changes COSTS & CAPITAL 33 2023 Core Business Annual Guidance. Stronger gross margin and reduced operating costs driving stronger EBITDA and reduced CapEx optimizing investment spend Revenue and Adjusted EBITDA guidance represents core business only and excludes any contributions from 2023 SmileMaker Platform rollout or launch of CarePlus program (1) Adjusted EBITDA is a non - GAAP financial measure. See appendix for definition of Adjusted EBITDA. Prior period reconciliations are available in historical SEC filings at https://investors.smiledirectclub.com/financial - filings/sec - filings .

Revenue Potential $125MM incremental contribution to Core Business CarePlus • Assumes CarePlus priced at $3,900 • Initial CarePlus launch to 4 DMAs occurred in February with planned rollout to all Partner Network locations throughout 2023 SmileMaker Platform (SMP) • SMP launched in Australia at end of November 2022 • U.S. launch targeted by end of Q2 Adjusted EBITDA Potential $80MM incremental contribution to Core Business • Leverages existing Core Business Operating Expense base to drive higher incremental margins 34 2023 Growth Initiatives Upside. Reflects Estimated Potential Contributions to Core Business from 2023 Growth Initiatives including SmileMaker Platform rollout and of CarePlus Program Launch Reflects 2023 contributions weighted to second half of 2023 due to timing of market launches (1) Adjusted EBITDA is a non - GAAP financial measure. See appendix for definition of Adjusted EBITDA. Prior period reconciliations are available in historical SEC filings at https://investors.smiledirectclub.com/financial - filings/sec - filings .

35 2023 Potential Full Business Outlook. Combines 2023 Core Business Guidance with 2023 Growth Initiatives Potential Contributions including SmileMaker Platform rollout in U.S. and Continued CarePlus Program Expansion (1) Potential growth initiative contributions weighted to second half of 2023 due to timing of market launches (1) Adjusted EBITDA is a non - GAAP financial measure. See appendix for definition of Adjusted EBITDA. Prior period reconciliations are available in historical SEC filings at https://investors.smiledirectclub.com/financial - filings/sec - filings . Measure Core Business Growth Initiatives Potential Contribution (1) Potential Full Business Revenue $400M to $450M $125M $525M to $575M Gross Margin 72.0% to 75.0% 85.0% 75.0% to 77.0% Operating Income ($140M) to ($100M) $80M ($60M) to ($20M) Adjusted EBITDA ($35M) to ($5M) $80M $45M to $75M CapEx $35M to $45M One-Time Costs $12M to $15M Change in Cash $4M Ending Cash $122M Accessible Cash $66M
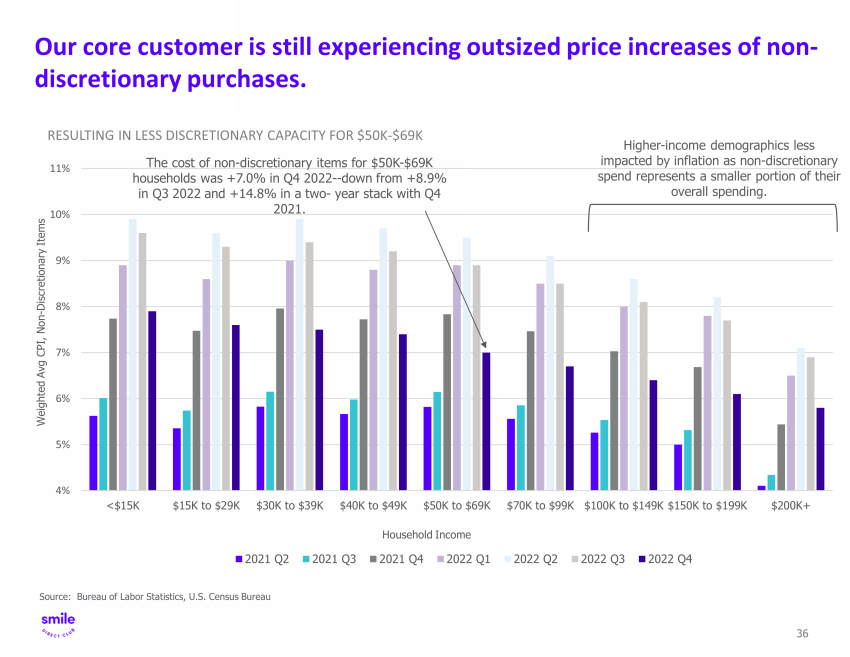
36 36 Our core customer is still experiencing outsized price increases of non - discretionary purchases. RESULTING IN LESS DISCRETIONARY CAPACITY FOR $50K - $69K Source: Bureau of Labor Statistics, U.S. Census Bureau 4% 5% 6% 7% 8% 9% 10% 11% <$15K $15K to $29K $30K to $39K $40K to $49K $50K to $69K $70K to $99K $100K to $149K $150K to $199K $200K+ 2021 Q2 2021 Q3 2021 Q4 2022 Q1 2022 Q2 2022 Q3 2022 Q4 Household Income Weighted Avg CPI, Non - Discretionary Items The cost of non - discretionary items for $50K - $69K households was +7.0% in Q4 2022 -- down from +8 .9 % in Q3 2022 and +14.8 % in a two - year stack with Q4 2021 . Higher - income demographics less impacted by inflation as non - discretionary spend represents a smaller portion of their overall spending.

37 37 Economic sentiment on major purchases remains down since February 2022. Source: ESI: February 1, 2023 Publication Titled ‘ Economic s entiment f alls as consumer spending slows ’ URL: https://esi - civicscience.pentagroup.co

38 Gr o w th P lat f orms C h a n n el / P rod u ct Gr o w th D r i v ers Organic Volume Growth and Footprint Expansion x Grow through organic customer penetration with normalizing economic backdrop x Continue to focus marketing efforts to enhance brand awareness and adoption x Strategic and disciplined expansion in targeted markets and within dental offices Retail Partnerships and Adjacent Product Expansion x Expand LTV through additional oral care and ancillary products x Retainers x Whitening treatments x Oral care products x Expand key retail partnership with Walmart and others, that serves as potential on - ramps to expand brand awareness SmileMaker make it easier to get started x Leverage our growing innovation portfolio to launch new products, features and services x Reduces timeline for customers to make purchasing decision from days or weeks to minutes x Increase sales conversion and customer access to drive revenue growth Successfully Target Higher Income Consumers x Sell to higher income customer and teen segments x Grow our professional channel – the Partner Network using CarePlus x Continuing to move upstream by adding premium features, services, and experience through CarePlus Multiple avenues to achieve outsized growth.

5 1 39 Appendix.

• SDC U.S. SmilePay SPV (“SPV”) is a wholly - owned special purpose subsidiary of the Company • The Company entered into a Loan Agreement (the “Loan Agreement”) by and among SPV, as borrower, SmileDirectClub,LLC as the seller and servicer, the lenders from time to time party thereto, and HPS Investment Partners, LLC, as administrative agent and collateral agent • Subject to certain exceptions, the Loan Agreement is secured by first - priority security interests in SPV’s assets, which consist of certain receivables, cash, intellectual property and related assets. SPV’s obligations under the Loan Agreement are guaranteed on a limited basis by SmileDirectClub, LLC and SDC Financial LLC (collectively, the “Guarantors”). • This facility enables us to access additional liquidity on favorable terms by leveraging our receivables and providing us with greater flexibility to fuel ongoing operations and execute on growth initiatives. 40 Secured Debt Facility Amount $255 million Security Interest Certain Receivables, Cash & IP Maturity 42 months Delayed Draw Availability 18 months Interest L+700bps Cash & 375bps PIK Undrawn Commitment Fee 275bps 40 Summary of debt facility.

5 1 41 Other SEC related disclosures.

42 US & Canada ROW Q4 2022 Comparison Q4 2022 % of Total QoQ Q4 2022 % of Total QoQ Total Unique Aligner Orders Shipped 32,728 78.9% (19.0%) 8,734 21.1% (26.9%) Average Aligner Gross Sales Price $1,999 N/A 2.7% $1,814 N/A 3.7% Total Revenue $71.9mm 83.0% (17.6%) $14.7mm 17.0% (25.2%) Gross Profit $44.4mm 84.1% $8.4mm 15.9% Gross Margin % 61.7% 57.4% S&M $50.9mm 79.4% $13.2mm 20.6% As % of Total Revenue 52.5% 63.5% G&A $47.9mm 79.6% $12.3mm 20.4% As % of Total Revenue 71.5% 67.1% Adj EBITDA (1) ($34.5mm) ($12.8mm) US/Canada vs. ROW. (1) Adjusted EBITDA is a non - GAAP financial measure. See appendix for definition of Adjusted EBITDA. Prior period reconciliations are available in historical SEC filings at https://investors.smiledirectclub.com/financial - filings/sec - filings . US & Canada ROW Full Year 2022 Comparison FY 2022 % of Total YoY FY 2022 % of Total YoY Total Unique Aligner Orders Shipped 188,738 81.1% (30.5%) 44,049 18.9% (27.7%) Average Aligner Gross Sales Price $1,937 N/A 3.9% $1,809 N/A (8.1%) Total Revenue $395.1mm 83.9% (24.8%) $75.7mm 16.1% (32.6%) Gross Profit $279.4mm 85.2% $48.5mm 14.8% Gross Margin % 70.7% 64.0% S&M $234.3mm 80.7% $55.9mm 19.3% As % of Total Revenue 59.3% 73.9% G&A $225.7mm 81.2% $52.2mm 18.8% As % of Total Revenue 57.1% 69.0% Adj EBITDA (1) ($92.7mm) ($41.8mm)

43 Three Months Ended December 31, Year Ended December 31, (In thousands) 2022 2021 2022 2021 Net loss ($69,431) ($95,365) ($277,853) ($335,650) Depreciation and amortization 16,786 18,458 74,354 70,113 Total interest expense 6,591 1,877 17,961 23,154 Income tax (benefit) expense (174) (308) (642) 1,268 Restructuring and other related costs 1,799 2,039 19,668 3,798 Equity - based compensation 5,049 6,969 26,608 44,628 Other non - operating general and administrative costs (7,957) 4,699 5,250 59,485 Adjusted EBITDA ($47,337) ($61,631) ($134,613) ($133,204) Note: Adjusted EBITDA is a non - GAAP financial measure. Net Income to Adjusted EBITDA.

44 Market Mar 31, 2021 Jun 30, 2021 Sept 30, 2022 Dec 31, 2022 United States 85 88 89 93 Canada 8 8 7 7 United Kingdom 7 9 9 12 Australia 7 7 6 6 France (1) 2 5 5 5 Ireland 1 1 1 1 Total 110 118 117 124 SmileShop Bridge. Currently 9% of SmileShops are located within Dental Practices (1) Subsequent to 12/31/2022, SDC began winding down operations in France beginning in January 2023.

45 Three Months Ended December 31, Year Ended December 31, (In thousands) 2022 2021 2022 2021 Cash Flow From Operations ($51,470) ($43,452) ($158,174) ($141,519) Cash Flow From Investing (11,828) (36,283) (51,996) (106,567) Free Cash Flow ($63,298) ($79,735) ($210,170) ($248,086) Note: Free Cash Flow is a non - GAAP financial measure. Cash Flow from Operations to Free Cash Flow.

46 Gross to Net Revenue Bridge. ($ in millions; except for Aligners Shipped and ASP) Q3 2021 Q4 2021 Q1 2022 Q2 2022 Q3 2022 Q4 2022 Total Unique Aligner Orders Shipped (1) 69,906 66,133 76,254 62,705 52,367 41,462 Average Aligner Gross Sales Price ("ASP") $1,900 $1,899 $1,890 $1,917 $1,902 $1,960 Aligner Gross Revenue 132.8$ 125.6$ 144.2$ 120.2$ 99.6$ 81.3$ Implicit Price Concession (2) (10.7) (13.6) (13.9) (11.0) (8.9) (10.4) Reserves and other adjustments (3) (13.9) (13.0) (11.3) (10.3) (10.6) (8.1) Aligner Revenue (4) 108.3$ 99.0$ 118.9$ 98.9$ 80.1$ 62.8$ Financing Revenue (5) 10.9 9.8 9.1 9.0 8.2 7.4 Other Revenue and adjustments (6) 18.5 17.5 23.5 17.8 18.4 16.4 Total Net Revenue 137.7$ 126.3$ 151.6$ 125.7$ 106.8$ 86.5$ Note: All information in this file is publicly available from our SEC filings. (1) Each unique aligner order shipped represents a single contracted member. (2) Estimated based on historical write-off percentages and expected net collections. Excludes implicit price concessions on financing revenue. (3) Includes impression kit revenue, refunds and sales tax. (4) As defined in quarterly and annual filings (Aligner Gross Revenue less IPC and Reserves and other adjustments). (5) Represents interest income earned on our SmilePay financing program, net of IPC starting in 2019, as noted in footnote 2 above. (6) Includes net revenue related to retainers, whitening, and other ancillary products.

• This convertible debt financing strengthens our balance sheet, with minimal equity dilution, and fortifies us against a protracted COVID environment, while also enabling to us to comfortably execute our growth strategy over the coming years, while also investing in R&D, innovation, and other business development opportunities. 47 Convertible Debt Key Terms Base Deal Size $650 million Green Shoe (exercised) $97.5 million Coupon 0.00% Conversion Premium/Price 40.0% / $18.06 Settlement Date February 9, 2021 Maturity February 1, 2026 Capped Call Key Terms Capped Call Lower Strike 40.0% / $18.06 Capped Call Upper Strike 100.0% / $25.80 Net Premium 9.3% of proceeds Effective all - in Rate/Terms ~2.0% Cost of Capital up 100% 47 Summary of convertible debt terms.

6 1